A first post showing how code, data, and results live together in a Quarto blog, with a small R example.
Author
Douglas A. Parry
Published
9 Jul 2026
This blog is written in Quarto, which means every post can contain real, runnable code. When I publish, Quarto executes the code and drops the results (tables, figures, models) straight into the page. Nothing is copy-pasted, so what you read is exactly what the code produced.
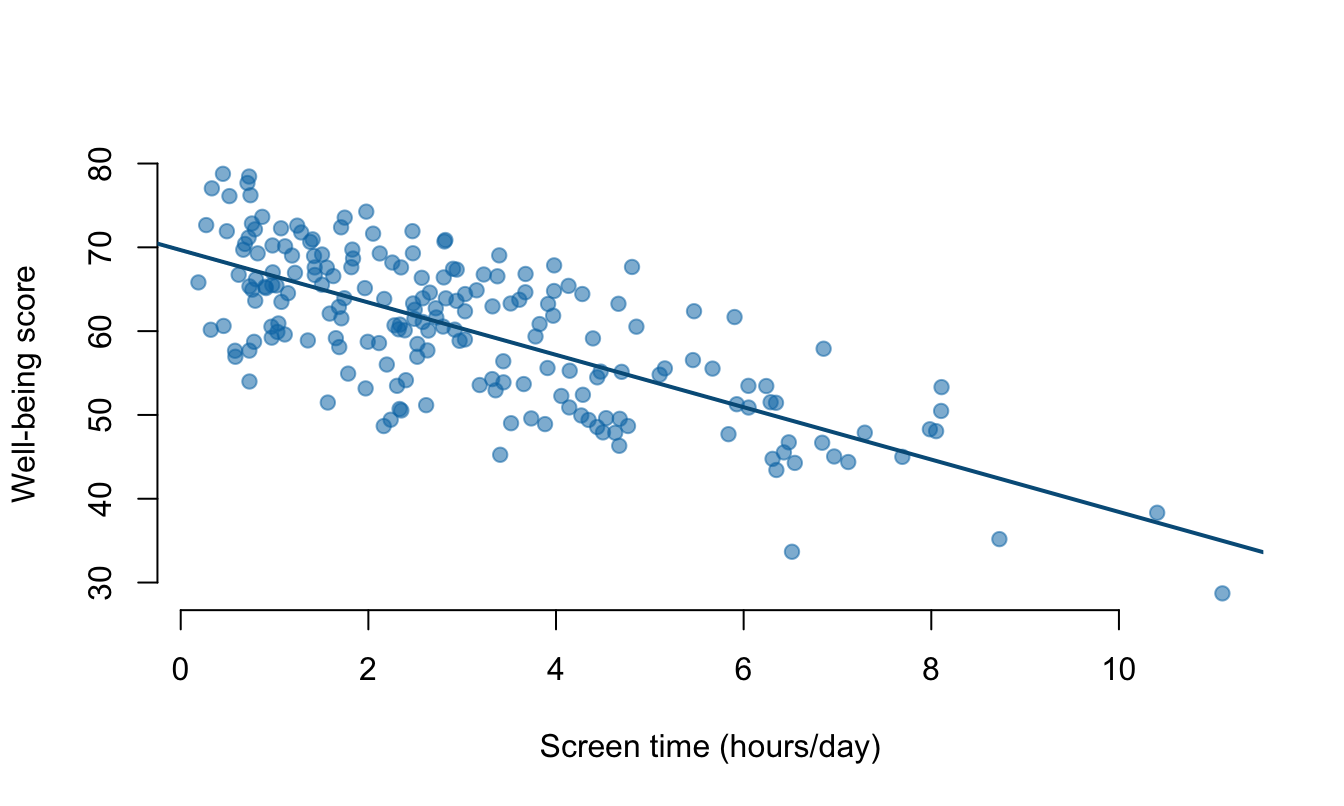
Here’s a tiny example. I’ll simulate some data on daily screen time and a well-being score, then plot the relationship.
fit <-lm(wellbeing ~ screen_time, data = d)summary(fit)
Call:
lm(formula = wellbeing ~ screen_time, data = d)

Residuals:
     Min       1Q   Median       3Q      Max
-15.6435  -4.8790   0.2777   4.7178  13.0123

Coefficients:
            Estimate Std. Error t value Pr(>|t|)
(Intercept)  69.6767     0.7788   89.47   <2e-16 ***
screen_time  -3.1250     0.2100  -14.88   <2e-16 ***
---
Signif. codes:  0 '***' 0.001 '**' 0.01 '*' 0.05 '.' 0.1 ' ' 1

Residual standard error: 6.245 on 198 degrees of freedom
Multiple R-squared:  0.5279,    Adjusted R-squared:  0.5255
F-statistic: 221.4 on 1 and 198 DF,  p-value: < 2.2e-16
And the figure, with the code that draws it right above it in the source:
plot(d$screen_time, d$wellbeing,pch =19, col ="#0077b388",xlab ="Screen time (hours/day)",ylab ="Well-being score",bty ="n")abline(fit, col ="#005c88", lwd =2)
Figure 1: Simulated association between daily screen time and a well-being score.
That’s the whole idea: the analysis and the write-up are one document. To add a post, I create a new folder under posts/, drop an index.qmd inside, and write. Because of freeze: true in posts/_metadata.yml, the code only re-runs when I change the post, so rebuilding the site stays fast even as the analyses pile up.
Source Code
---title: "Reproducible analyses in R, on a webpage"description: "A first post showing how code, data, and results live together in a Quarto blog, with a small R example."date: "2026-07-09"categories: [R, open science, meta]image: "thumbnail.png"---This blog is written in [Quarto](https://quarto.org), which means every postcan contain real, runnable code. When I publish, Quarto executes the code anddrops the results (tables, figures, models) straight into the page. Nothingis copy-pasted, so what you read is exactly what the code produced.Here's a tiny example. I'll simulate some data on daily screen time and awell-being score, then plot the relationship.```{r}#| label: setupset.seed(42)n <-200screen_time <-rgamma(n, shape =2, scale =1.6) # hours per daywellbeing <-70-3.1* screen_time +rnorm(n, 0, 6) # arbitrary scaled <-data.frame(screen_time, wellbeing)head(d)```A quick linear model:```{r}#| label: modelfit <-lm(wellbeing ~ screen_time, data = d)summary(fit)```And the figure, with the code that draws it right above it in the source:```{r}#| label: fig-screentime#| fig-cap: "Simulated association between daily screen time and a well-being score."#| fig-width: 7#| fig-height: 4.2plot(d$screen_time, d$wellbeing,pch =19, col ="#0077b388",xlab ="Screen time (hours/day)",ylab ="Well-being score",bty ="n")abline(fit, col ="#005c88", lwd =2)```That's the whole idea: the analysis and the write-up are one document. To add apost, I create a new folder under `posts/`, drop an `index.qmd` inside, and write.Because of `freeze: true` in `posts/_metadata.yml`, the code only re-runs when Ichange the post, so rebuilding the site stays fast even as the analyses pile up.